Results of PCR Via Electrophoresis: (Laboratory Mechanism of Genotyping Fruit Flies)

\

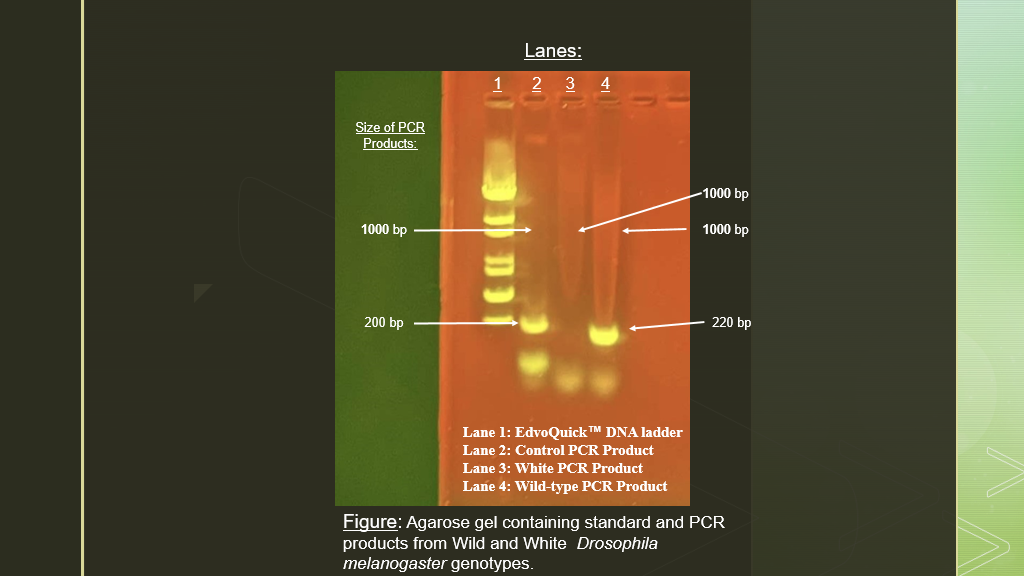
The gel figure displays the PCR products from the wild and white genotypes of the common fruit fly Drosophila. Additionally, lane 1 consists of the DNA ladder. Whereas, lane 2 consists of the control PCR product. More specifically, the only observable band within lane 2, was the 200 bp band. Moreover, within lane 3 there are no observable DNA bands present. Lastly, lane 4 consists of the PCR products from the wild-type flies, the only band present was the 220 bp band.

As previously discussed, the physical basis and observable results of the experimental process and mechanism, can be seen within Figure 1: the agarose gel containing the PCR products from wild and white genotypes of Drosophila. For instance, four lanes were utilized in this experimental process. For example, lane 1 is the DNA standard marker, also classified as the DNA ladder. Whereas, lane 2 consisted of the PCR products of the control. The third lane consisted of the PCR products from white-eyed flies. Whereas, the fourth lane consisted of the PCR products from the wild-type flies. Furthermore, within lane 2, a 1,000 bp control band and a 200 bp band were expected to be observed. However, the only observable band present within the lane was the 200 bp band. Moreover, within the third lane, a 1,000 bp band was to be observed. But, there are no observable bands present in this lane. Lastly, within the fourth lane, the 1,000 bp band and the 220 bp PCR product were expected to be displayed. Yet, the only observable band displayed was the 220 bp band. Therefore, it is reasonable to assume that the observed results are not consistent to the expected results. Although, there are deviations, such as: the absence of particular bands within lanes. It is entirely possible to recognize troubleshoots and potential explanations for such discrepancies.

The white eyed Drosophila were expected to have a band at 1,000 bp, observed within their lane. Whereas, the wild-type Drosophila were expected to have a band at 1,000 bp and 220 bp. However, the results observed from the experimental gel revealed that the white-eyed Drosophila had no apparent base pairs, due to the lack of bands present. Alongside, the wild-type Drosophila, which only contained one visible band: 220 bp. Thus, it is reasonable to conclude that the results of the experiment were skewed, due to a potential error within the procedures. Specifically, that the Drosophila DNA sample had an improper concentration, the sample was potentially degraded, or incorrect volumes of primer and DNA were added to the PCR reaction. 


Comments

Popular posts from this blog

Production of Aspirin (BioChem)

What are Biogenic Amines?

The Use Of HPLC-EC: Hydrodynamic Voltammograms (Neuropharmacology)